Automating monthly product reports to increase quality & efficiency
Reduced time to generate monthly product reports from up to 40 man-hours each month to roughly 5 minutes while increasing quality & consistency of report output. Enabled Product Management team to focus on using report insights to manage business rather than collating data.

Need
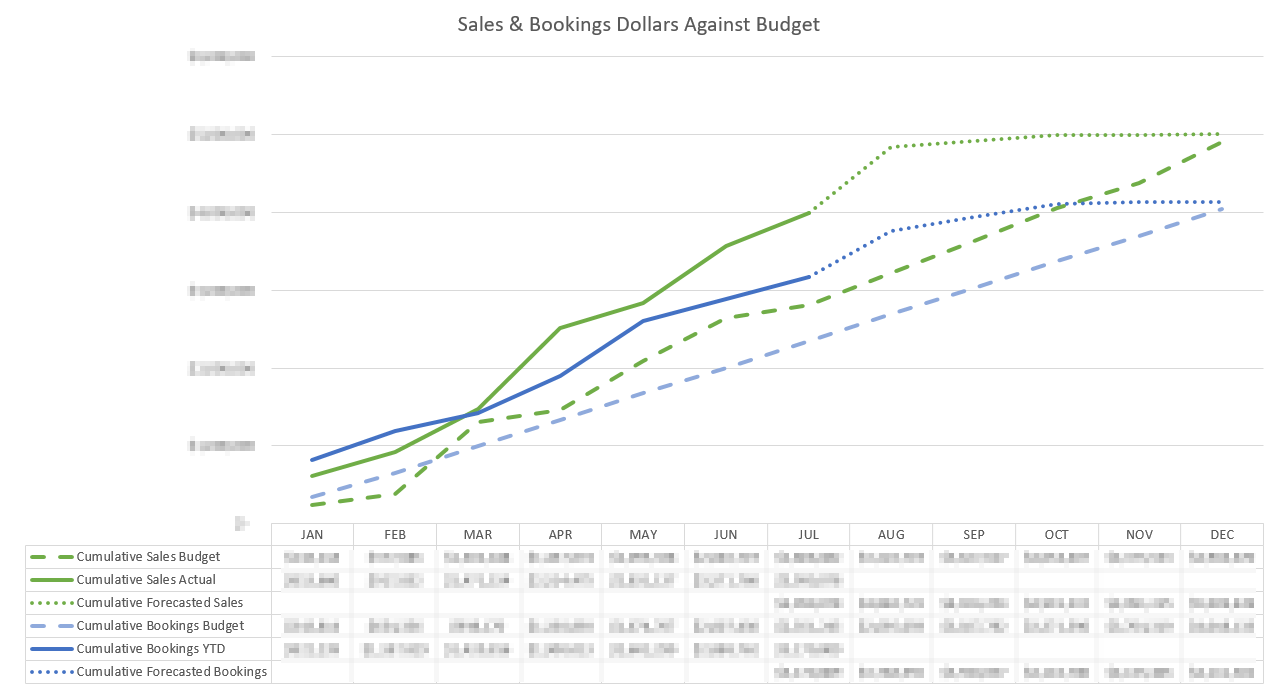
Business analyzes sales performance by product line on a monthly basis. Analysis is performed on invoiced sales, booked sales, and sales pipeline to measure performance against expectations. Additionally, data is sliced by sales regions, various timescales, and by both dollars & units.
Challenge
Product Management team (team of 5) was spending up to 40 man-hours per month generating reports that were requested by Senior Leadership team. Data needed to be assembled from three independent systems.
- Accounting system for Invoiced Sales
- Order Processing system for Booked Sales
- Customer Relationship Management (CRM) system for Sales Pipeline
The report format, naming conventions, and layout differred for each data source. As a result, data was being manually categorized which was time-consuming and error-prone.
Templates were being managed on each contributors local computer which resulted in variance over time and an inconsistent output from product line to product line on the final report.
Solution
Developed a Python program to to process data sources (accommodating for differences in layout and nomeclature) and develop a unified data model.
Processed data was then interpolated and fed into a Excel-based template engine to output chart and graph formats that were being created manually. Using Excel-based templates also allowed for future modifications to the format/presentation without changes being required to the program
Automation of report generation process allowed for identification of even deeper insights due to time saved on compiling basic data. Additionally, report quality, accuracy, & consistently greatly improved for all contributors.